
You are reviewing work made by a tool you use differently.
On 12 August 2026 a group of researchers posted a working paper analysing ChatGPT Enterprise usage linked to worker roles, message-level task classifications and public company financials. At the six-month adoption horizon the sample covers "over 1,500 organisations and over 17 million messages". It is an unusually direct look at how AI use is distributed inside firms rather than across them, and it runs on account records through March 2026 rather than on what people say they do.
Three of its five authors are at OpenAI and the other two hold dual OpenAI and university affiliations. This is a vendor analysing its own telemetry, the paper has not been peer reviewed, and its header notes that results are subject to change. That is a reason to read the direction rather than the decimal places, not a reason to ignore it, particularly since the paper states its own limitations more carefully than most.
What the data says about who is actually using it
The headline finding for anyone who leads people is a distribution, not a total.
"The clearest pattern is a strong negative seniority gradient in message volume," the paper reports. "Among adopters, early-career workers and trainees send roughly eight to nine more weekly messages than the average active user within the same firm, while managers, directors, and executives send fewer messages."
Note the two constraints in that sentence. It is within the same firm, so it is not a story about different companies. And it is conditional on active use, so it is not a story about who has a licence.
The paper is careful to stop you overreading it. The composition of active users, it says, "is not the same as a role-specific adoption rate, because we do not observe the denominator of all employees by role". And on the distribution across levels: use "spans multiple levels of the organizational hierarchy, rather than being concentrated among either junior employees or senior leadership". Both halves are true. Leaders are in the tool. They are simply in it less, and for different work.
The part that changes how you lead, not just what you know
Volume is the interesting half of the finding. The task mix is the important half.
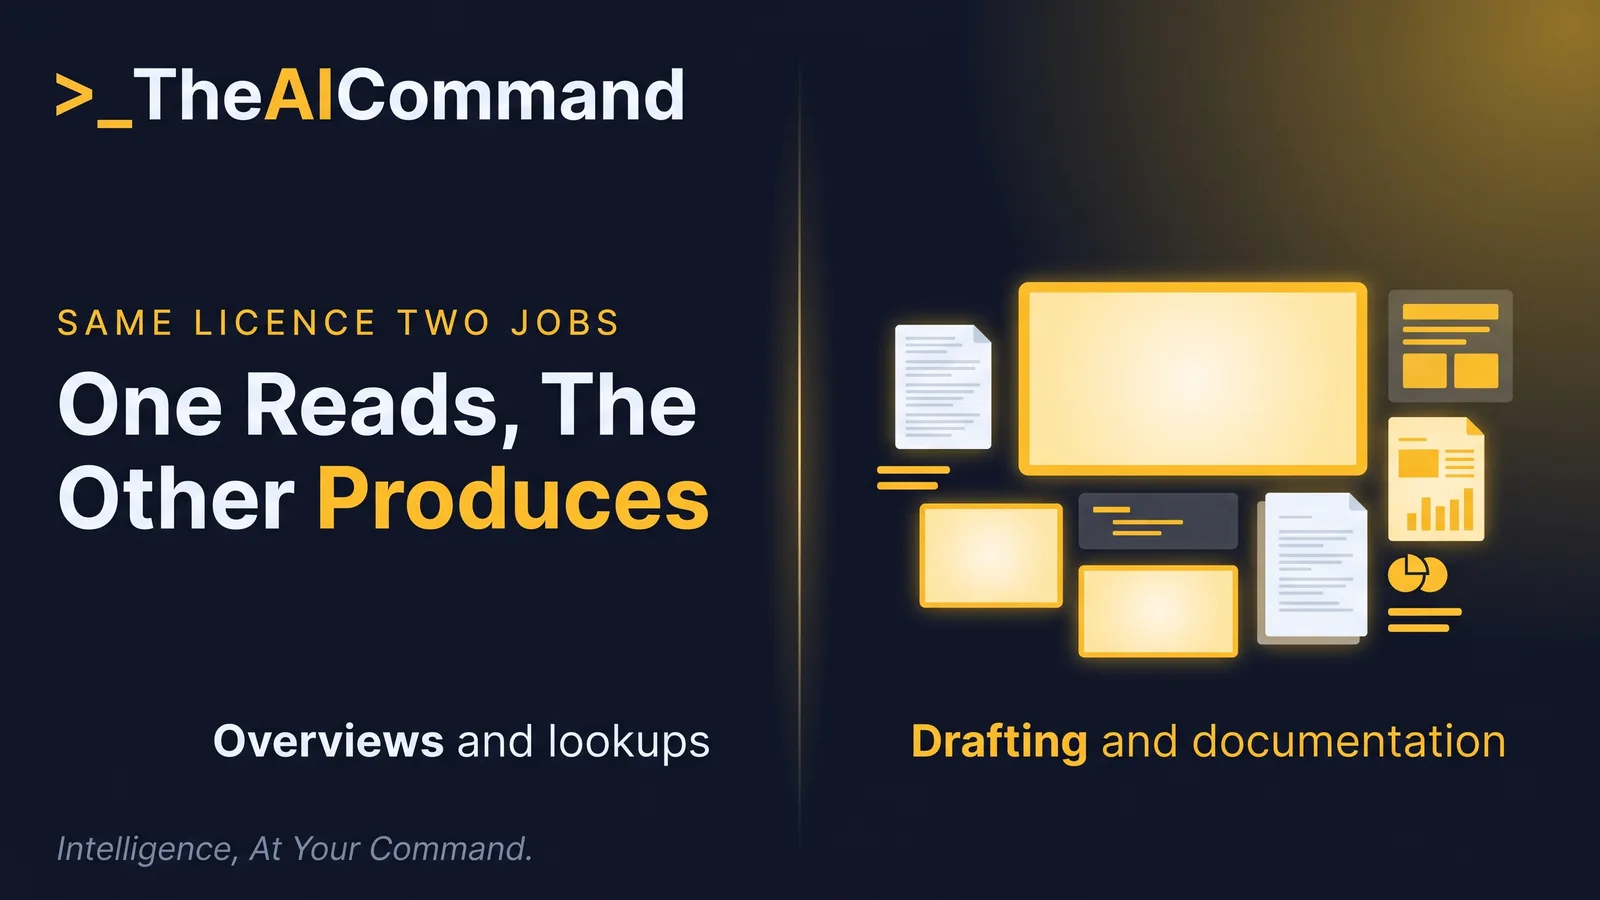
"Early-career workers and individual contributors have high prevalence in several common production-oriented categories," the paper reports, "whereas executives are relatively more represented in categories such as topic overviews, facts and figures, legal and regulatory work, and financial or tax-related tasks."
Read that as two different products. Not two different populations: the paper is explicit that early-career workers, individual contributors, managers and executives all use the common production categories. What shifts with seniority is the mix.
If your first-hand experience of AI is the left column, your instincts about how risky it is, how fast it should be, and how much checking it needs are calibrated on the left column. Then you write guidance, or approve someone else's, and it lands on the right column.
That is how an organisation ends up with an AI policy that is simultaneously too relaxed about drafting and too anxious about lookups. Nobody was careless. The person setting the standard was reasoning from the wrong sample of one.
The second signal, pointing the same way
An independent dataset lands in the same place. In March 2026 a group of researchers published a National Bureau of Economic Research working paper on AI, productivity and the workforce, drawing on the 2025 fourth-quarter survey run with Duke University and the Federal Reserve Banks of Atlanta and Richmond. The abstract describes a survey of nearly 750 corporate executives; the appendix records that 603 completed the AI questionnaire, a 24 percent response rate against a panel of roughly 2,500 financial executives.
Its central finding is a gap between belief and measurement. "We document a productivity paradox," the authors write, "in which perceived productivity gains are larger than measured productivity gains, likely reflecting a delay in revenue realizations." For 2025, mean reported labour productivity growth attributable to AI was 1.8 percent, while the growth implied by those same executives' reported revenue and employment changes was 0.6 percent. For 2026 the expectation is 3.0 percent reported against 1.8 percent implied.
This is a different dataset, a different method and a different question, so it does not explain the first finding. It is consistent with it. For 2025 senior people reported gains three times larger than their own revenue and employment numbers imply, and senior people are the ones with the least direct contact with the production use of the tool. Two observations pointing the same way is worth a leader's attention even when neither proves the other.
The operating move: a fortnightly calibration block
The fix is not more dashboards. It is one hour, twice a month, in your own calendar.
- Pick a real task from your team's queue. Not a demo, not a summary of your own inbox. The class of artefact your people actually produce with AI: a policy note, a client email chain, a code review, a first-draft report.
- Do it end to end in the tool they use. Same tenancy, same model, same context they have. If you cannot get access to what they use, you have found something more important than the exercise.
- Review your own output at the standard you impose on them. If your rule is that every figure is traced to source, trace every figure. Time how long that takes. That number is your review tax, and it is the one leaders systematically underestimate.
- Write down where it broke. Not whether it was impressive. Where it was confidently wrong, where it dropped a caveat, where it needed context it could not have.
- Take one rule to the team. Change or confirm exactly one line of your operating guidance based on what you just found, and say which use pattern it applies to.
The last step is the one that compounds. When you write or approve AI guidance, name the use pattern each rule was written for. A rule that makes sense for a regulatory lookup can be actively harmful applied to a drafting task, and the reader cannot tell which you meant unless you say.
The judgement boundary
Three lines a leader should not cross with this finding.
Do not turn intensity into a target. Volume "should be interpreted as a measure of usage intensity rather than as a complete measure of economic importance", and the moment message counts appear in a performance conversation you will get message counts. This site has argued the case for measuring the work that improved rather than the prompts sent, and nothing here changes it.
Do not read the gradient as a competence ranking in either direction. Heavy use is not skill, and light use is not restraint. The early-career workers running the highest volume are the same people who still owe an apprenticeship, and fluency in a tool is not judgement about the work.
And do not use the calibration block to take the work back. The point is not to prove you can still do it. It is to know what you are asking of the people who do it every day, so that when you set the team's AI norm, the norm is calibrated to their job rather than yours.
A short worked example
[TEAM] runs eleven people. The leader's own AI use is almost entirely orientation: regulatory summaries before a meeting, background on a counterparty, a quick read of a standard. Their guidance to the team, written in March, says to "check anything important before it goes out".
In the first calibration block, the leader drafts a client-facing summary of the kind [ANALYST_ROLE] produces weekly. The draft is good. Tracing its four figures to source takes 35 minutes, longer than writing the draft, and one figure turns out to be correct but stripped of the qualifier that made it meaningful.
Two things change. The guidance now reads that any figure leaving the team carries its source locator and its qualifier, which is a production rule, not a general one. And the leader stops describing the review step as a formality, because they have now measured it at 35 minutes and can resource it.
There is a related pressure worth naming: the volume being reviewed is not what it was when the licence was approved. The same paper reports that aggregate output tokens produced by ChatGPT Enterprise customers "grew roughly sevenfold between June 2025 and March 2026, and by nearly fourfold within a consistent cohort of firms that adopted between January 2024 and June 2025", so about half the growth happened inside organisations that had already adopted. The decision to approve the tool was made once. The volume kept moving.
Do this Monday
- Book two hours in the next month. Two blocks, fortnightly, in your own calendar, not your team's.
- Ask one question in your next one-to-one. What did you use AI for last week, and what did you have to fix. Ask for the task, not the tool.
- Read your current AI guidance with one pencil mark. Beside each rule, write O for orientation or P for production. Any rule you cannot classify was written without a use pattern in mind.
- Get yourself into the team's tenancy. If the leadership licence differs from the working licence, you cannot calibrate on their experience.
- Time your own review once. Whatever your checking rule is, do it properly once and record the minutes. That figure belongs in your next resourcing conversation, alongside the review tax it represents.
Bottom line
The most useful thing in the enterprise telemetry is not that AI use is growing. It is that within a single firm, seniority predicts both how much AI someone uses and what they use it for, and the senior pattern is orientation while the junior pattern is production. Leaders are writing the rules for a use pattern they have not personally run. The correction is cheap and unglamorous: one hour a fortnight doing your team's actual work in your team's actual tool, held to your own standard, and one rule changed as a result. Judgement about work you have not done recently is just an opinion with a title attached.
References
- Chatterji, Holtz, Rakholia, Tambe and Weeratunga, How Organizations Use AI: Evidence from ChatGPT, arXiv:2608.12236, submitted 12 August 2026. Working paper, not peer reviewed. https://arxiv.org/abs/2608.12236
- Baslandze, Edwards, Graham, McClure, Meyer, Sparks, Waddell and Weitz, Artificial Intelligence, Productivity, and the Workforce: Evidence from Corporate Executives, National Bureau of Economic Research Working Paper 34984, March 2026. Working paper, not peer reviewed. https://www.nber.org/papers/w34984
- Microsoft, Aussie Workers Charge Ahead with AI, While Leadership Falls Behind, 2026 Work Trend Index Australian release, Microsoft Source Asia, 16 June 2026. https://news.microsoft.com/source/asia/2026/06/16/aussie-workers-charge-ahead-with-ai-while-leadership-falls-behind/
TheAICommand. Intelligence, At Your Command.