
To know whether AI improved the work, measure a defined workflow before and after across elapsed time, human effort, quality, rework, risk and the customer or decision outcome, not the number of prompts staff send.
Activity is easy to count. Value is harder.
A team sends 40,000 prompts in a month. Is that good?
It might mean staff found a useful tool. It might mean the model needs five retries for every task. It might mean a small group is experimenting while the core workflow remains unchanged. It might mean people are pasting work into a system without an approved use case.
The number is not useless. It is simply incapable of answering the question leaders keep asking it to answer.
What should you measure instead of prompts?
AI measurement often begins with what the vendor dashboard provides: active users, prompts, tokens, minutes and features used. Those are adoption and cost signals. They do not show whether work became faster, better, safer or more useful.
The distinction is visible in current research. Noy and Zhang's professional-writing experiment measured completion time and independently rated output quality, finding a 40 per cent reduction in time and an 18 per cent increase in quality for the studied tasks. Brynjolfsson, Li and Raymond measured issues resolved per hour in customer support and reported a 14 per cent average productivity increase, with substantial differences by worker experience.
Both studies measured work and outcomes. Neither treated prompt volume as the result.
At organisation level, the picture is less settled. A 2026 NBER survey of nearly 6,000 executives across the US, UK, Germany and Australia found 69 per cent of firms actively using AI, while around nine in ten reported no impact on employment or productivity over the previous three years. That does not mean AI lacks value. It means adoption and impact are different variables.
Google Cloud's 2025 DORA research on AI-assisted software development describes AI as an amplifier of existing organisational strengths and weaknesses, with returns depending on the underlying system rather than the tool alone. The domain is software development, but the measurement lesson is broader: assess the system in which AI operates.
The leadership shift is from a tool dashboard to a workflow scorecard.
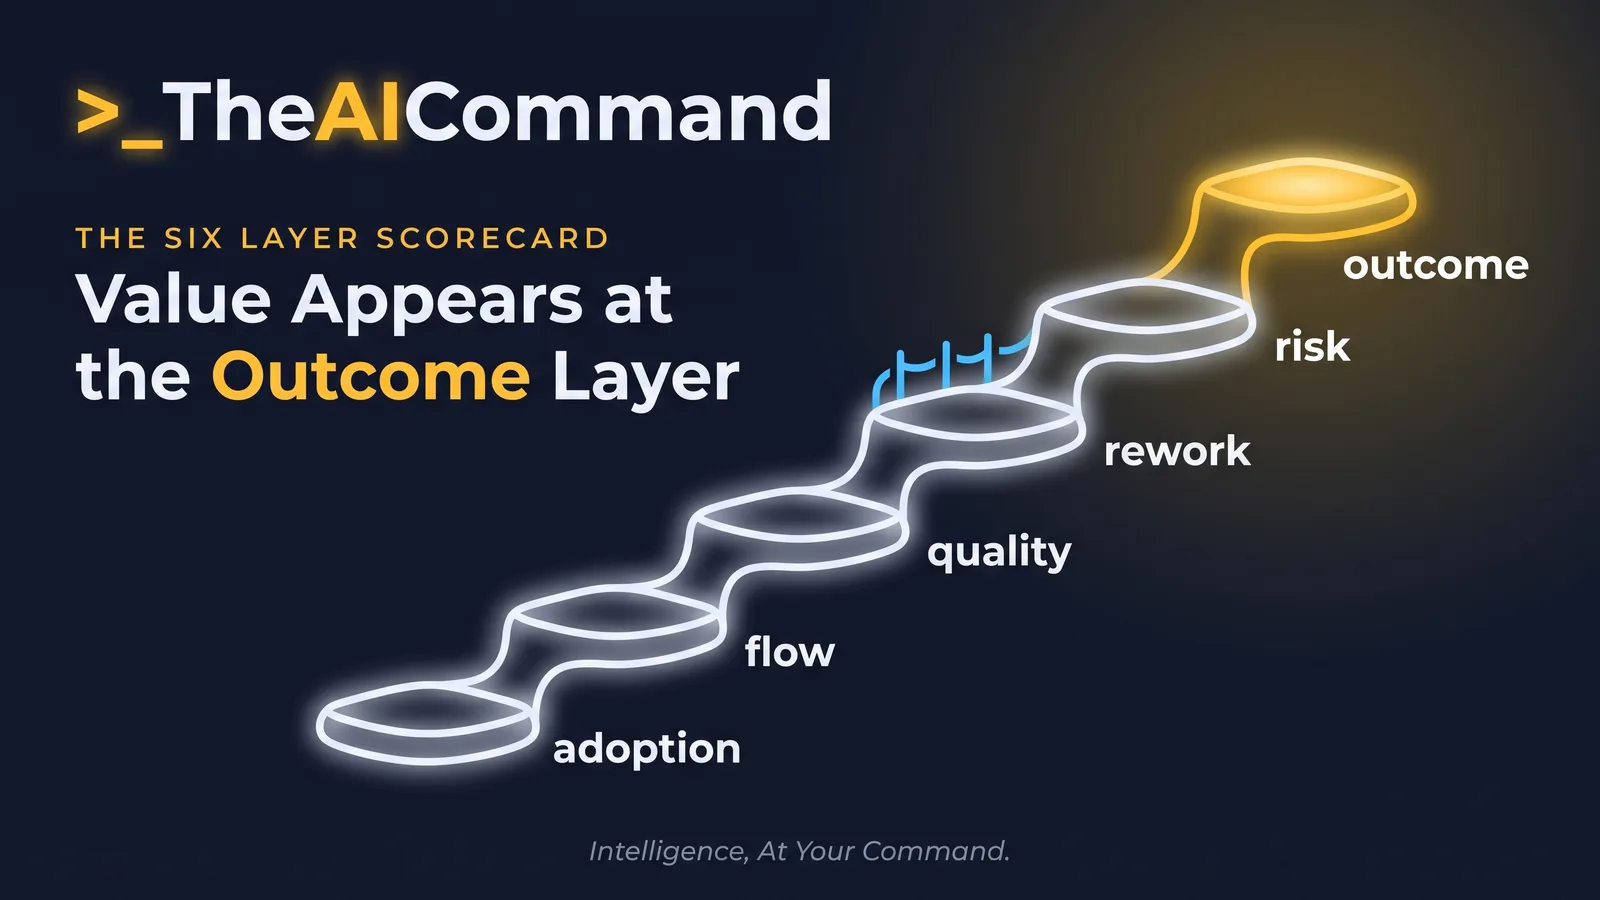
How do you build a six-layer AI scorecard?
Choose one recurring workflow with a named recipient and outcome. Examples include resolving a customer query, preparing a risk decision, producing a first draft, handling an exception or completing a quality review.
Record a baseline before changing the work. If no baseline exists, use a controlled comparison or a short observation period. Do not backfill a convenient number after the rollout.
The scorecard has six layers:
Layer 1: adoption
Use vendor telemetry to answer diagnostic questions:
- Who has access?
- Who uses the approved feature?
- Which teams have not started?
- Are costs or usage changing unexpectedly?
Prompt counts belong here. They can identify training needs, unexpected cost or a workflow worth examining. They do not earn a green productivity status.
Watch the surveillance boundary. Do not turn individual prompt volume into a performance target. Staff may avoid complex, careful work or generate pointless activity to satisfy the metric. Collect the minimum data needed, explain its use and apply employment and privacy controls.
Layer 2: flow
Measure how work moves:
- elapsed time from request to usable outcome
- active human time
- queue time
- handoffs and approvals
- work in progress
- completion rate
Elapsed time and human effort are different. AI may cut drafting time while adding a two-day review queue. A workflow that saves one role ten minutes and adds another role twenty has not improved.
Layer 3: quality
Define quality before the trial. Measures may include error rate, completeness, policy adherence, factual accuracy, customer corrections, defect escape or independent rubric score.
Do not let the same model generate and grade the work without an external standard. Use human sampling, source checks or a separate validated test where appropriate. Track severity as well as frequency. One material error can outweigh fifty clean drafts.
Layer 4: rework
AI changes where effort appears. Measure:
- number of retries
- reviewer edits
- returned work
- exceptions escalated
- time spent checking sources
- work recreated after an error
This is where the AI review tax becomes measurable. A tool can produce faster first drafts while increasing total work. The scorecard should make that visible.
Layer 5: risk and control
Track incidents and near misses linked to the use case, such as personal-data exposure, unsupported claims, missed escalations, policy breaches, unauthorised use, inaccessible outputs or failures to retain evidence.
Also measure control performance: percentage of required reviews completed, exceptions caught before release, time to pause a faulty workflow and completion of corrective actions. A low incident count is not proof of safety if nobody looks.
Layer 6: outcome
Connect the workflow to why it exists. Did customer resolution improve? Did a decision arrive earlier? Did the team recover capacity for higher-value work? Did fewer cases reopen? Did the leader receive better evidence?
Outcome measures should be specific and proportionate. Not every writing assistant can be tied to revenue. It can still be tied to usable first-pass quality, approval time and rework. The point is to measure the closest credible value, not invent a heroic financial attribution.
Use a measurement contract
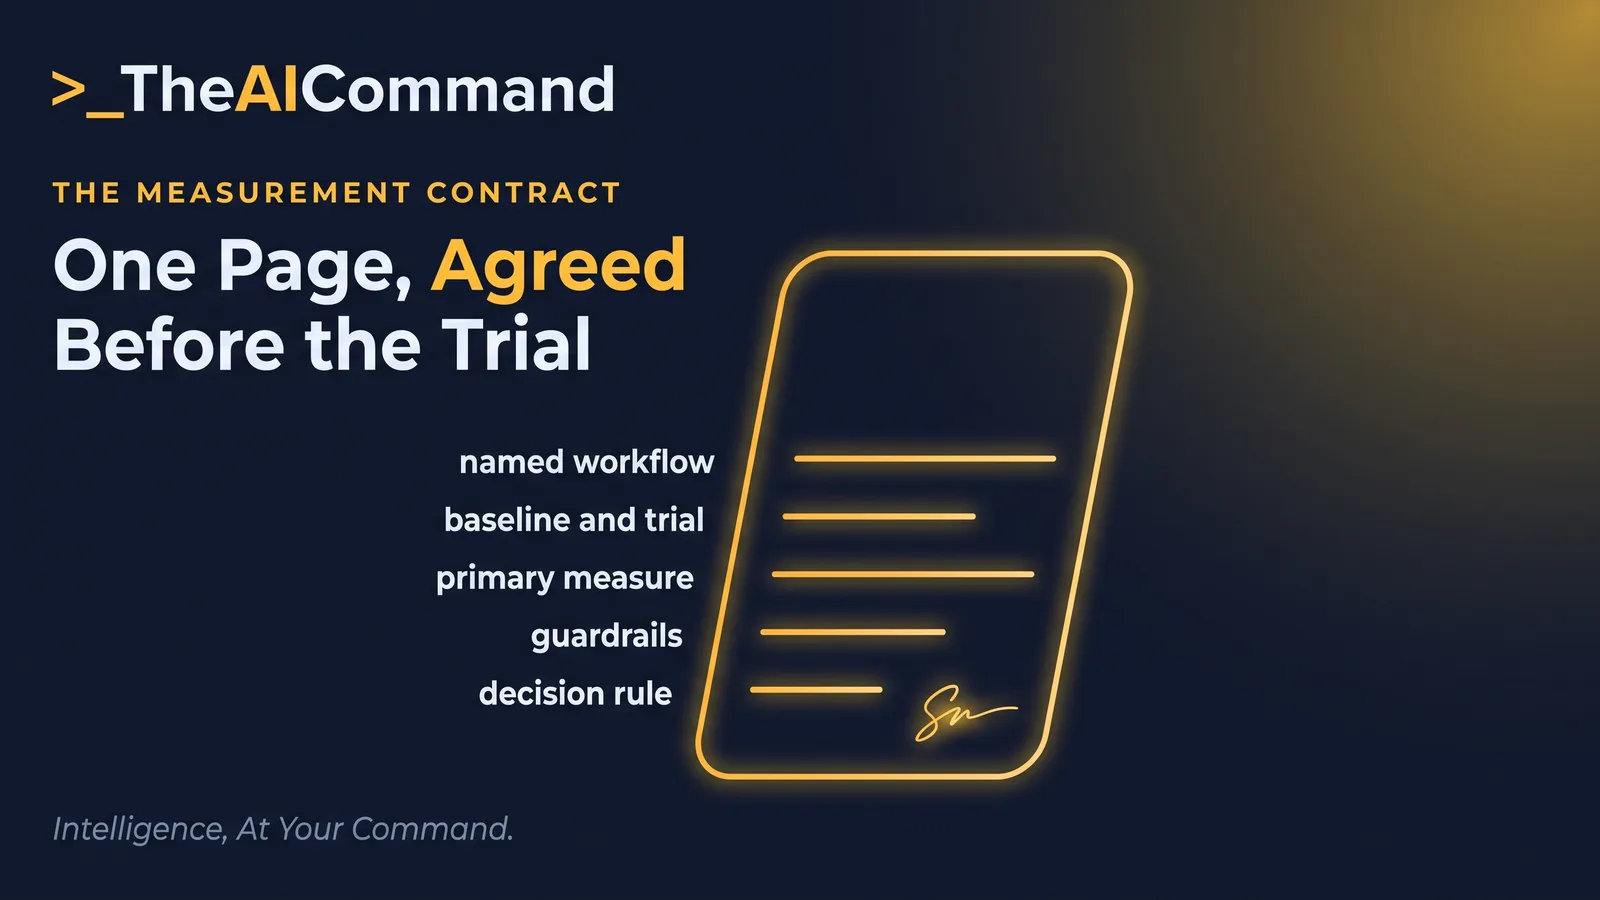
Before the trial, write a one-page contract:
The decision rule prevents retrospective storytelling. For example: scale only if median elapsed time falls by at least 15 per cent, material-error rate does not rise, reviewer effort does not increase and staff report no unmanageable load shift. The threshold is an internal choice, not a universal benchmark.
Why segment the results?
Averages hide who benefits and where risk concentrates. The customer-support study found larger gains for novice and lower-skilled workers, with minimal effect for experienced, highly skilled workers. That does not guarantee the same pattern elsewhere. It shows why segmentation matters.
Cut results by task complexity, role, experience, channel and risk tier. A tool may improve routine drafts and harm novel cases. It may help new starters while slowing experts. It may reduce handling time while raising escalations.
Do not use small segments to rank individuals. Use them to refine the workflow, training, review tier and access rules.
Be honest about attribution
A before-and-after improvement does not prove AI caused the change. Volume, staffing, seasonality, policy changes and learning effects may have moved at the same time. Record those factors and avoid claiming more certainty than the trial supports.
Where practical, compare similar teams, time periods or task batches. Stagger the rollout, keep a non-AI baseline for a sample, or randomise suitable low-risk tasks between the current and proposed method. The design should fit the consequence. An internal writing aid does not need a clinical trial. A material decision workflow needs stronger evidence than an enthusiasm survey.
Use median and distribution, not only an average. A ten-minute average saving can hide a small group of complex cases that take an hour longer. Report exception rates and worst-case severity beside central performance.
Separate observed results from estimates. "Median handling time fell from 24 to 18 minutes during the six-week trial" is an observation. "The change will save 4,000 hours a year" is a projection that depends on future volume, adoption and sustained quality. Label it and show the assumptions.
Keep qualitative evidence too. Staff interviews can explain why rework rose or why a control was bypassed. Customer feedback may show that faster responses became less useful. Treat these accounts as evidence to investigate, not as decorative quotes around a predetermined success story.
Document confidence in the final conclusion: high, moderate or low, with the reason. A small clean trial can justify another trial without justifying enterprise scale.
The judgement boundary
Metrics do not remove leadership judgement. They discipline it.
Leaders decide which outcomes matter, which errors are intolerable, how benefits and burdens are distributed and whether the evidence is strong enough to scale. Risk, privacy, HR, legal and domain specialists may need to review the measurement design.
Human accountability also means listening to the people doing the work. Ask where AI saved effort, where it created checking, what expertise started to erode and which exceptions became harder to recognise. Quantitative measures can miss workarounds until the workaround fails.
Do not attach individual prompt quotas to performance management. Do not infer low capability from low usage. A person may have no suitable use case, may be protecting sensitive data or may be doing the work efficiently without the tool. Measure the workflow and discuss behaviour in context.
A worked example
[TEAM] uses an approved assistant to draft responses to internal policy questions. The dashboard reports 6,200 prompts and 78 per cent monthly active use. Leadership calls the rollout successful.
The workflow scorecard changes the picture. Drafting time falls from 18 to 9 minutes. Review time rises from 4 to 10 minutes because answers cite policies imprecisely. Twelve per cent of drafts need substantial rework. Simple questions improve. Complex exceptions take longer because reviewers must reconstruct the model's reasoning.
The team changes the design. AI is limited to simple and moderate questions grounded in the current policy library. Complex exceptions route directly to a specialist. The response template requires a source clause and an uncertainty flag. Review sampling varies by risk tier.
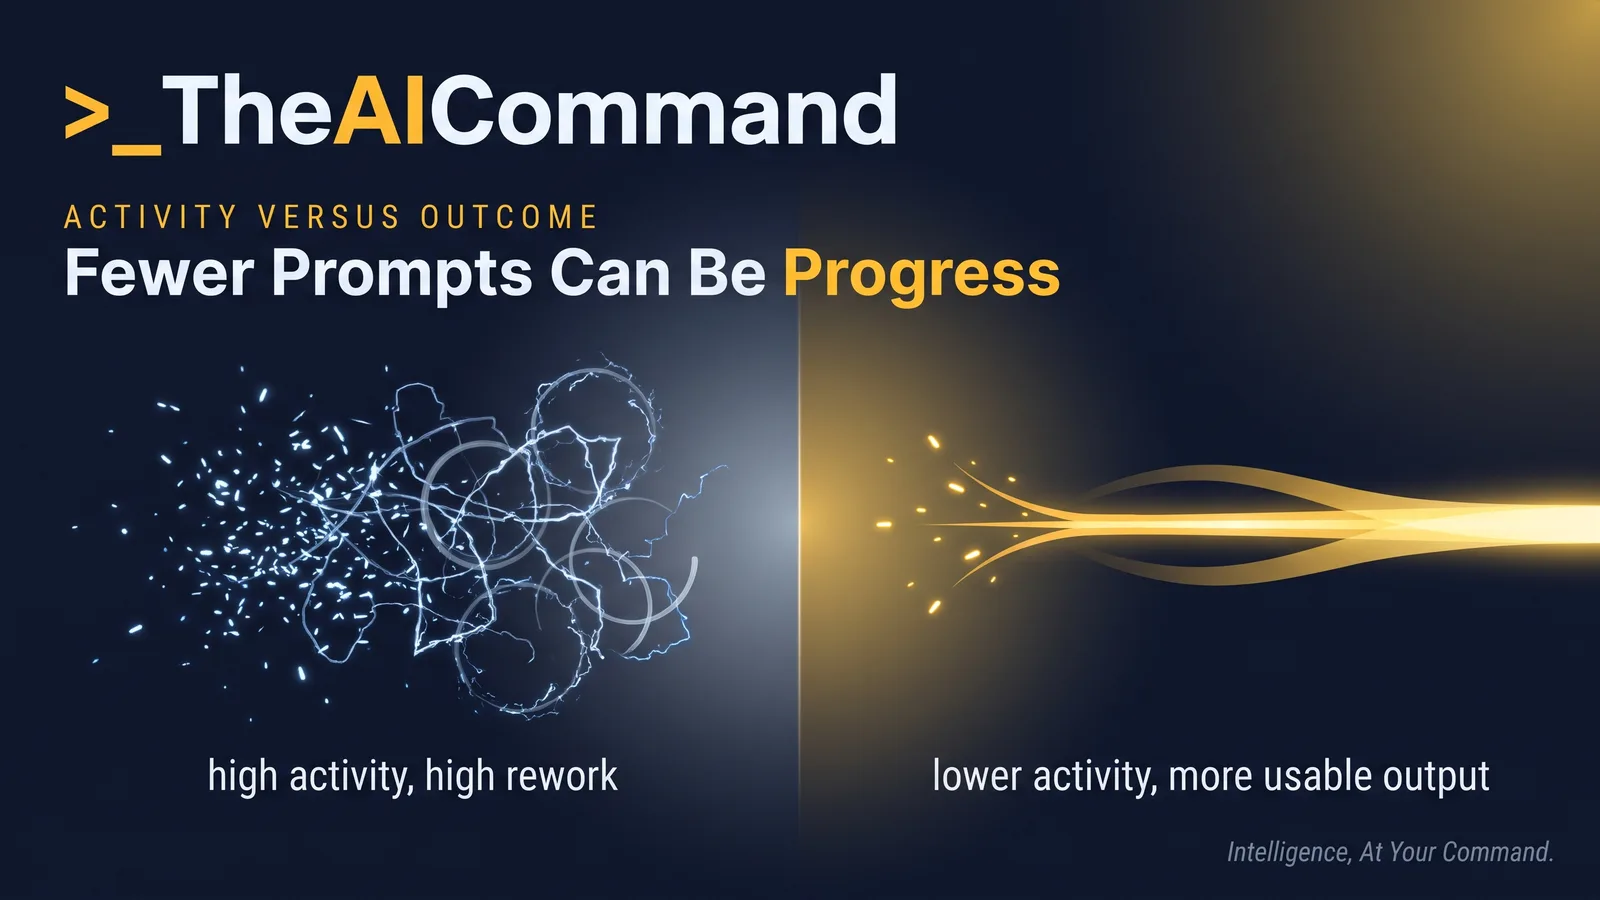
The second trial tracks total handling time, clause accuracy, substantial rework, escalations and staff load. Prompt volume drops. Usable output rises. Under the old dashboard, that would look like weaker adoption. In the workflow, it is improvement.
Put measurement into the operating rhythm
Review the scorecard at a fixed cadence. The AI operating rhythm for managers can hold a monthly use-case review and a quarterly stop, change or scale decision.
Pair measurement with visible management behaviours. The AI literacy guide treats verification, privacy and escalation as operating habits. Add outcome measurement to that list. A leader who asks only for active-user growth teaches the team to optimise activity.
Bottom line
Prompt counts measure tool activity, not whether the work improved. Pick one workflow, baseline it, then measure the change across flow, quality, rework, risk and outcome, with a decision rule set before the trial. Keep the human accountable for whether the evidence is strong enough to scale.
Do this Monday:
- Choose one recurring workflow with a named recipient and outcome, and record a baseline before you change anything.
- Write a one-page measurement contract with a single primary measure, guardrails and a decision rule.
- Keep prompt counts as adoption diagnostics only, and never make individual prompt volume a performance target.
- Track error severity as well as frequency, and segment results by task, role and complexity.
- Report median and distribution, and label projections separately from observed results.
TheAICommand. Intelligence, At Your Command.