
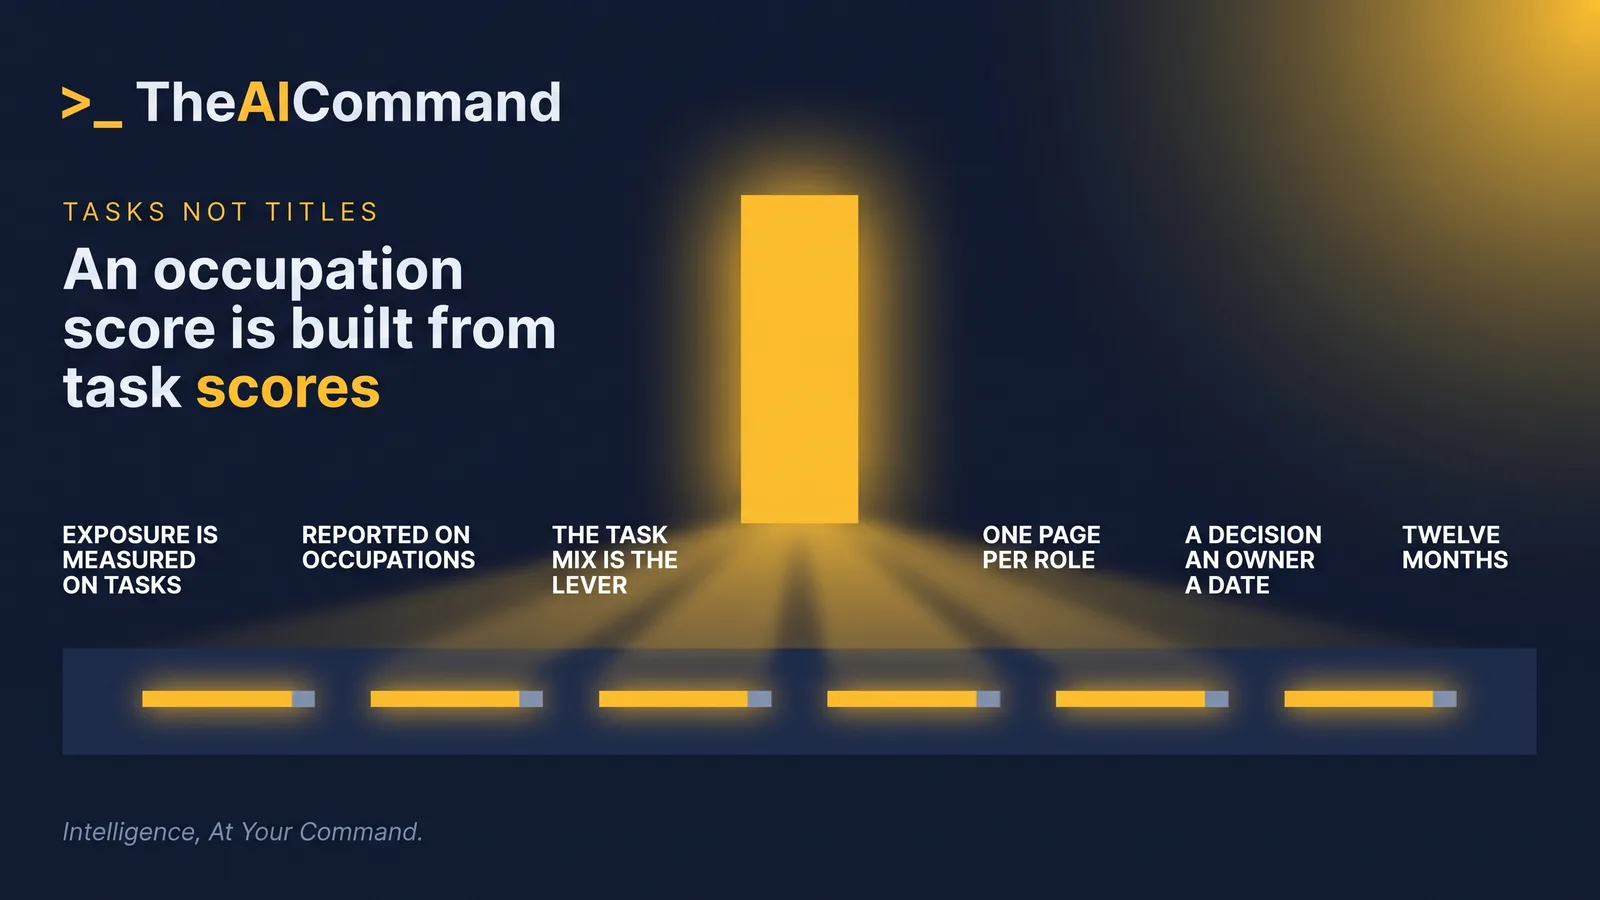
Exposure is measured on tasks and reported on occupations.
That one step, from the task up to the job title, is why the Australian exposure evidence cannot tell a team leader anything about headcount. The Department of Employment and Workplace Relations (DEWR) published The AI and employment in Australia report on 8 July 2026. Its announcement page states that "There is no evidence to date of broad AI-driven labour-market upheaval in Australia." The same page states that "occupations more exposed to potential automation by generative AI have grown more slowly than other occupations." Nothing has broken. Something is already uneven.
The practitioner consequence is narrow. The only lever a team leader holds over exposure is the task mix inside each role, because exposure was assembled out of tasks long before it was ever attached to a job title. Take the two most exposed roles on the team, split each into its recurring tasks, and decide which tasks each role keeps for the next twelve months. The output is one page per role, owned by the team leader, carrying a decision, an owner by role and a review date on every line.
What the Australian numbers actually measure
The DEWR figures are not a forecast, and the department says so on the same page. The report "is designed to monitor current developments in the Australian labour market, not to forecast potential future outcomes."
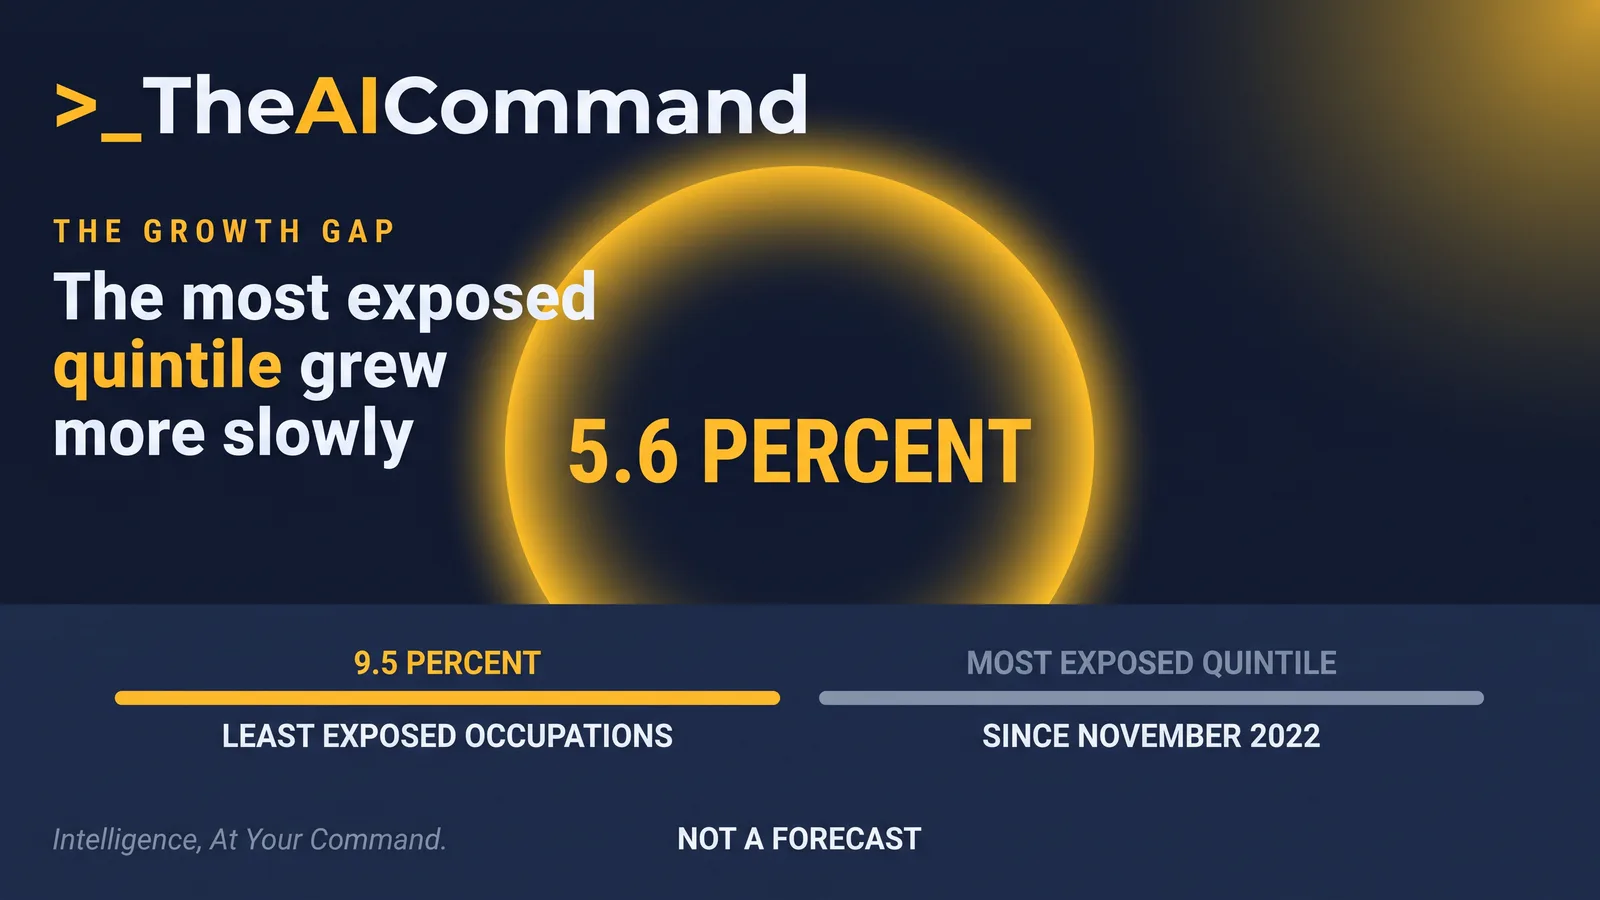
The reading itself sits in the full report, AI and employment in Australia, an 84 page document from the Office of the Chief Economist published on 8 July 2026. Since November 2022, employment in the most exposed quintile of occupations has grown by 5.6 percent. Over the same period, employment in the least exposed occupations has grown by 9.5 percent. Those are fixed values inside a published edition drawing on Australian Bureau of Statistics (ABS) Labour Force data to February 2026. They are quoted here as that edition reports them, not as a live market condition as at 26 September 2026.
The report attaches a caution to its own comparison. The quintiles differ in occupational composition and in pre-existing growth trends, and the slower growth in the more exposed group may reflect the continuation of earlier occupational trends or other sector specific developments.
The split is drawn against a treatment date of 30 November 2022. Occupations are ranked by an exposure score and cut into fifths. The report measures all five, and records that the most exposed fifth has grown more slowly than every other quintile. The headline figures compare the top with the bottom.
Then comes the sentence that carries the argument. The report states that it "does not examine firm-level AI adoption, changes in tasks within jobs or changes in skill requirements for occupations."
The national dataset stops precisely where a team leader starts. It establishes that exposure is uneven across the labour market. It does not describe what is happening inside the two roles on one team.
Why does a gap of 3.9 percentage points not name a single job?
Because the gap compares two large groups of occupations, and every occupation in each group is itself a mix of tasks.
The report does go further than the raw comparison. It models the relationship, and reports that an occupation one standard deviation above average exposure had employment around 2 percent lower by February 2026 than its earlier trend implies. The report carries its own qualification in the same breath: that result is not statistically significant under two alternative exposure measures, nor when the COVID-19 period is excluded from the pre-treatment sample. A finding that moves when the measure moves is one to monitor, not one to build a restructure on.
The composition of the two quintiles is more useful than either percentage. Ranked by employment level as at the February quarter of 2026, these are the ten largest occupations in each group, each column ranked on its own.
Read both lists as descriptions of work, not job titles. The exposed list is dominated by roles whose recurring output is a document, a record, a reconciliation or a message. The insulated list is dominated by roles whose recurring output requires a person to be physically present at a particular thing. That is a statement about tasks, and it holds inside a single role. An accountant who spends most of the week in client conversations is not the accountant the score describes.
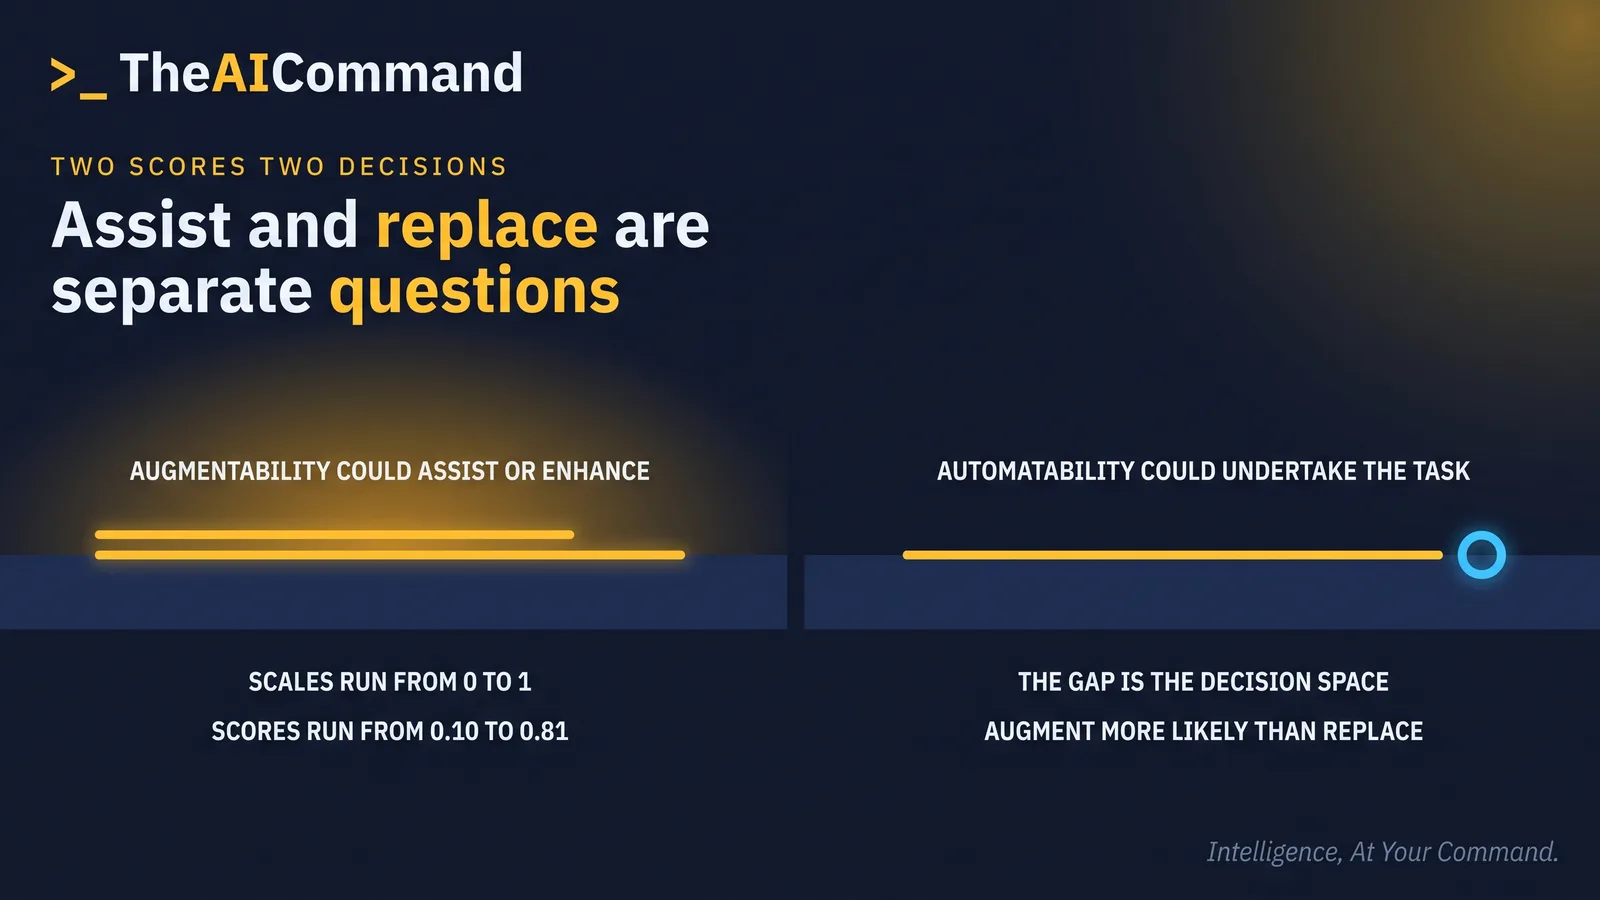
The scoring scale says the same thing. In theory the automation exposure scores run from 0 to 1. In practice the report records that no occupation is either fully exposed or fully insulated, so the observed automation scores run from 0.10 to 0.81. Every occupation is a blend, and a blend can be re-blended.
Does a national adoption figure describe any particular team?
No, and the spread underneath the headline is the reason.
The ABS Characteristics of Australian Business for the 2024-25 financial year, released on 25 June 2026, records how many businesses in each industry reported using AI. The industry that recorded the highest level of AI use was information, media and telecommunications, at 38 percent.
Eight of the seventeen divisions in the release are shown, ranked as published.
A spread from 38 percent to 1 percent inside one release is why a single national adoption figure describes nobody in particular. The ABS media release Business adoption of Artificial Intelligence accelerates in 2024-25, 25 June 2026, flags further AI content for the 2026-27 Business Characteristics Survey, so this release is the current edition rather than the final word.
Two cautions belong here, because the two datasets are easy to blur.
The first is that adoption and exposure are separate instruments. The ABS counts businesses that report using AI. Jobs and Skills Australia scores what generative AI could do to the tasks in an occupation. A business in a low adoption industry can employ a highly exposed role, and the reverse holds.
The second is that neither figure is the reader's own number.
What does a task level score look like inside one role?
It looks like two numbers, not one, and the augmentation score generally sits above the automation score.
The exposure scores DEWR uses come from the Jobs and Skills Australia Generative Artificial Intelligence Capacity Study, released across three stages between August and September 2025. The study finds that generative AI "is more likely to augment human work than replace it." That is the framing the exposure score sits inside, and a score quoted on its own does not carry it.
The method is set out on the study's exposure theme page, covering Paper A, last modified 23 January 2026. That page explains that Paper A "explores exposure to Gen AI at the task level among occupations, industries and cohorts." Each task receives two scores: augmentability, whether generative AI could assist or enhance it, and automatability, whether generative AI could undertake it. Both scales run from 0 to 1. The page also states that the study looks at "the spread of scores within each occupation", and that the scores "show potential, assuming Gen AI is fully adopted and used."
Four things follow, and together they are the article.
- Exposure is built at the task level, so the task is the natural unit of any decision made from it.
- Each task carries two scores rather than one, so assist and replace are separate questions with separate answers.
- The spread inside an occupation is itself measured, which means the variation between tasks in one job is a finding rather than noise.
- The scores describe potential under full adoption, which makes them a planning input, not an observation of what is happening in any workplace today.
The published occupation data table, last modified 30 September 2025, carries 357 occupations at unit level under version 1.3 of the Australian and New Zealand Standard Classification of Occupations (ANZSCO). A sample of management rows shows the pattern plainly.
Every one of those rows pairs a high augmentation score with a much lower automation score. Treated as one number, each of them reads as heavy exposure. Treated as two, each reads as a redesign brief: most of the work can be assisted, a smaller portion could be performed outright, and the gap between the two is the manager's decision space. DEWR records two further limits on the scores. They were produced on the capabilities of an earlier generation of large language models, which no longer represents the frontier of performance, and they do not consider the relative importance of tasks or their substitutability within an occupation.
Three prompts that turn a position description into a decision record
TheAICommand works to the Verified Draft Method: de-identify the inputs, ground the model in your own source material, keep a person at the decision point, verify against the primary source, and log what happened.
The study names the work being done here. Its adaptation theme page, covering Paper C and last modified 30 September 2025, defines vertical adaptation as changes within occupations or sectors, including "changing skill and task content within a single occupation as well as new specialisations or hybrid roles within occupations or sectors as technology augments or automates certain tasks." Horizontal adaptation, movement between roles, is somebody else's lever. Vertical adaptation is the team leader's.
The worked example is a leader of [TEAM_NAME] with two exposed roles, [ROLE_A] and [ROLE_B]. The inputs are the position descriptions the team already holds and a month of the role's own work records, from a task board export, a workflow queue report or a calendar the team already keeps. Strip names from both documents before attaching them, replacing each person with [PERSON_1], [PERSON_2] and so on, and the employer with [EMPLOYER]. Run the sequence once per role.
What to check: every row in the table traces to a line in the attached documents, and column 5 makes that check fast. Delete any row whose source line does not exist, and treat a row worded better than the position description as a warning that the model has started drafting rather than listing. Confirm that no real name survives anywhere in the output.
What to check: the answers spread across the list instead of clustering on one value. A column of identical answers means the task wording is too coarse to score, so go back and split the offending tasks. Every task marked yes on B either names a verification step or says "Verification step not stated", and each of those rows is one whose wording you go back and sharpen. The count underneath measures how well the team has described its own work.
What to check: column 2 is empty on every row when the output arrives, because a model that has filled it has made the decision the manager was supposed to make. Every row carries a role, not a person name. Column 4 names the check on the output, not who performs it, so re-word it on any row you mark keeps, and a row naming no check cannot be marked hands over. The list underneath the table is the queue of rows that need a conversation.
The record, and what each column is for
The finished page is one table per role with five columns and no empty cells.
Three decisions, each meaning something different in practice.
- Keeps means the task stays with the person and no assistant touches it, which is the right answer wherever the output carries judgement about a person.
- Assists means an assistant drafts or checks and the named owner verifies before anything leaves the team.
- Hands over means the assistant performs the task and the owner samples the output on a stated cadence, which is only available where the second prompt returned a verification step.
What this evidence cannot be made to say
Four claims are not available from any source used here.
It does not say that AI is cutting jobs in Australia. The 8 July 2026 report records no evidence to date of broad AI-driven upheaval, and qualifies its own modelled estimate.
It does not convert into a headcount. A comparison of growth rates between two groups of occupations is not a proportion of roles at risk, and treating it as one is arithmetic the report does not support.
It does not measure any particular reader. Industry adoption is a count of businesses, occupational exposure is a national score built from task scores, and a team is neither.
And an exposure score is not a verdict on a person. It is a property of tasks, produced on the assumption of full adoption, in a study whose own conclusion is that augmentation is the more likely outcome. The earlier leadership piece Stop Predicting Their Jobs. Map Their Next Skills. makes the same move from prediction to mapping, and the task split described here is the step after it.
Where the task decision meets consultation
The page produced by the three prompts is a draft input, not an announcement.
The Fair Work Ombudsman best practice guide on consultation and cooperation in the workplace, content last updated 6 May 2026, states that "Consultation is important during major workplace change", and gives "different working hours, duties, work locations or redundancies" as examples of change that affects employees in a significant way. The same guide states that employers who take a consultative and cooperative approach "still have the right to make the final decision on how to manage their business."
Reallocating recurring duties across two roles can reach that threshold. The practical sequence is to draft the record, check the consultation clause in the applicable award or enterprise agreement, consult on the draft, and then finalise it. The decision stays with the manager. The order of operations does not. This is general information and not legal advice, and the applicable clause is the one that governs.
Do this Monday
The artefact is a one page twelve month task decision record for [ROLE_A], with a decision, an owner by role and a review date on every line, and no empty cells.
The owner is the team leader, [MANAGER], because the record allocates work.
The first sitting fits in an hour and needs nothing that does not already exist.
- Take the position description for the more exposed of the two roles and one month of that role's work records, and strip the names out of both.
- Run the first prompt on those two documents.
- Find the role in the Jobs and Skills Australia occupation data table linked above, using the table's category filter to bring up the occupation title closest to [ROLE_A], and write the augmentation and automation scores for that row's unit code [ANZSCO_CODE] at the top of the page as context rather than as instruction.
- Run the second prompt on the task list that comes back, then the third prompt on the scored list in the same sitting, fill the Decision column yourself, and give every row on the Owner not stated list a role before the check below.
The check that proves it worked has two parts. First, any person on the team can point at any [TASK] on the page and name the role that verifies its output. Second, every row carries the same review date, set inside twelve months, and that date has a meeting to land in.
The bottom line
The Australian evidence measures exposure on tasks and reports it on occupations, and the DEWR report published on 8 July 2026 states that it does not examine changes in tasks within jobs. That is not a weakness in the dataset but the boundary of it, and the beginning of the manager's work. A growth gap of 5.6 percent against 9.5 percent between the most and least exposed quintiles is consistent with exposure being uneven, and establishes nothing at all about any particular team. Split the two most exposed roles into tasks first. Decide what each role keeps second.
TheAICommand. Intelligence, At Your Command.