
Twelve percent is the wrong planning number for suppliers.
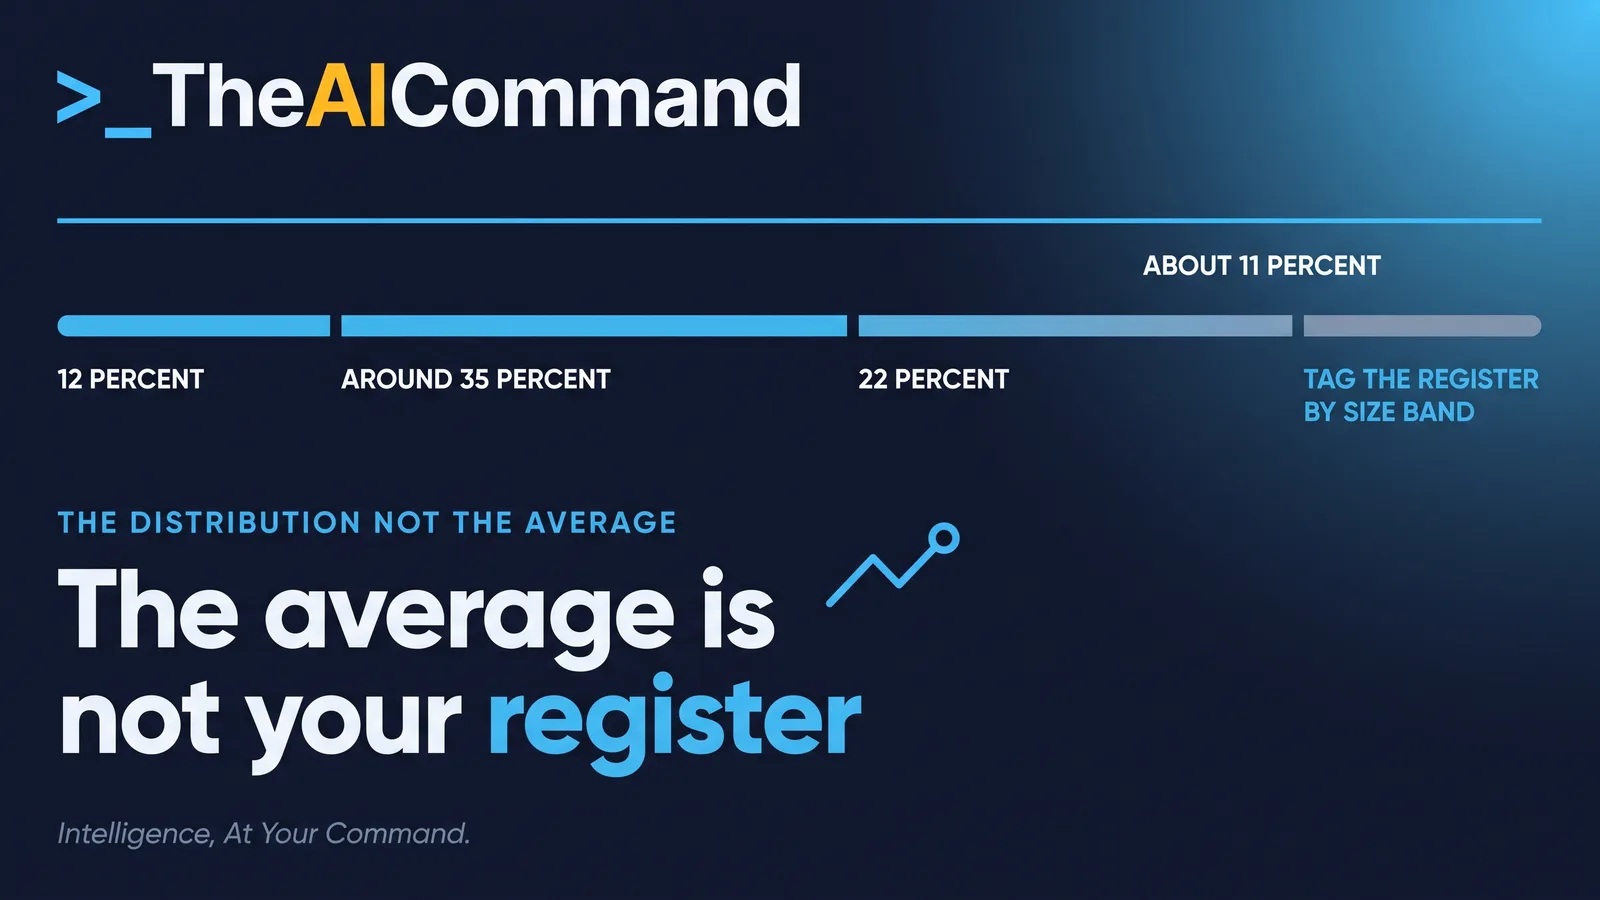
The Australian Bureau of Statistics has released a national read on business AI use, and the figure that will be quoted everywhere is the one least useful to a third-party risk function. Characteristics of Australian Business, 2024-25 financial year, released 25 June 2026, records in its information and communication technology section that "Almost one in eight (12%) businesses indicated they used Artificial Intelligence (AI) in 2024-25, compared to 1% in 2021-22."
The practitioner consequence sits one layer down. The same release and its companion media statement publish the distribution behind that average, by employment size and by industry division. A supplier register tagged against those two axes stops being an alphabetical list and becomes an ordering: which segment of the register most likely carries AI inside the service being bought, and therefore which segment gets the next round of due diligence questions. The rates are a prioritisation ordering and a floor, not odds on any named supplier.
What the ABS published, and what it measured
The dataset is the 2024-25 Business Characteristics Survey. The ABS methodology for Characteristics of Australian Business, 2024-25 states that "Collection of data included in this release was undertaken based on a random sample of approximately 7,000 businesses via online forms". The ABS media release of 25 June 2026 records that the survey ran from October 2025 to February 2026.
Two scope facts change how the number can be used. First, the methodology sets the scope as "all employing business entities in the Australian economy, except for" a list of exclusions that includes general government, Division O Public administration and safety, and Division P Education and training. The 12 percent is therefore a rate for employing businesses in scope. It cannot be applied to the whole business population.
Second, the reference period is historic. The methodology states that "The reference period for all data items included in the 2024-25 BCS is either during the year ended 30 June 2025 or as at 30 June 2025." Collection then ran to February 2026 and publication followed in June 2026. Every rate in this article describes behaviour up to 30 June 2025, which makes it a floor for a register being assessed as at 9 October 2026, not a current measure.
Why is the headline the least useful number?
Because an average assumes a population that resembles the national mix, and almost no supplier register does.
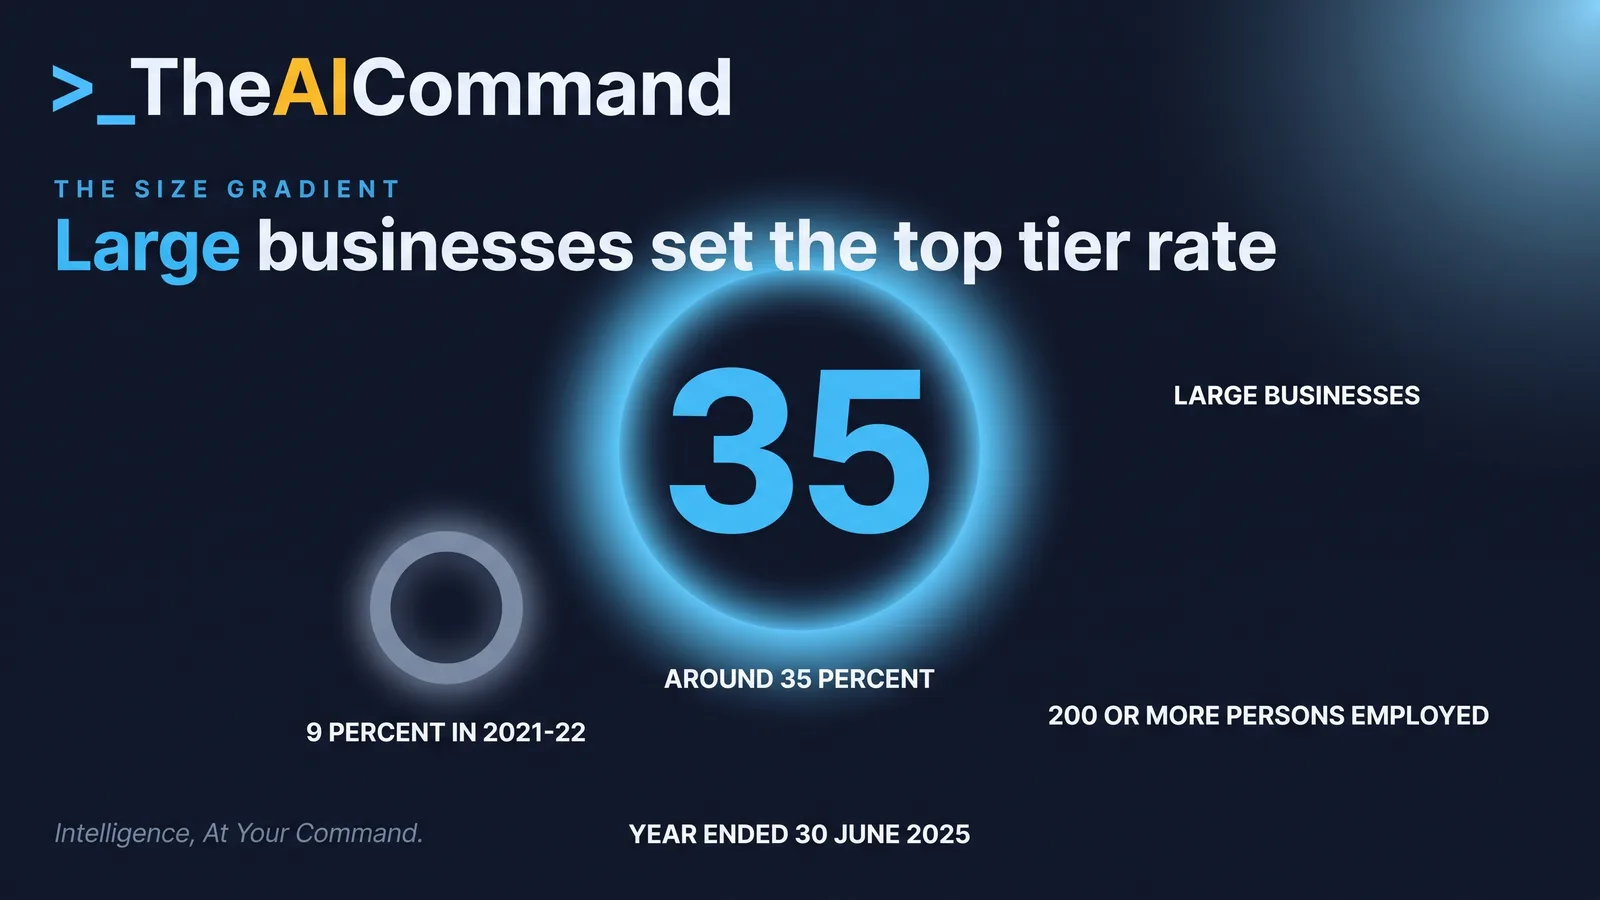
The size gradient is the first reason. The ABS media release of 25 June 2026 records around 35 percent of large businesses reporting AI use, up from 9 percent in 2021-22, and 22 percent of medium-sized businesses, against 3 percent previously. Uptake among small and micro businesses is stated as lower, at around 11 percent. Those are the published rates as at 25 September 2026. The band definitions come from the same methodology: micro is 0 to 4 persons employed, and large is 200 or more persons employed.
The industry spread is the second reason. The 2024-25 release records that "The industry that recorded the highest level of AI use was Information, Media and Telecommunications at 38%." Professional, scientific and technical services and Financial and insurance services both sit at 24 percent in the published table, while Transport, postal and warehousing sits at 1 percent. On those figures, as at 25 September 2026, the top division sits thirty-seven percentage points above the bottom.
Innovation status is the third. The release records that "The AI adoption rate was higher for innovation-active businesses (20%) compared to non-innovation-active businesses (6%)." The release publishes its own employment size figures only crossed with innovation status, at 37 percent for innovation-active large businesses and 29 percent for those that were not, so the all-business size rates used here come from the media release and the two sets are not interchangeable. Innovation activity also matters for a register because it is often visible in the service being sold, even when AI use is not.
How the size bands map onto a supplier register
Take a register of 400 active suppliers. Applying the headline rate flat gives an expected 48 AI-using suppliers.
Now weight it. Assume the register carries 40 large suppliers, 120 medium and 240 small and micro. That mix is a deliberately large-weighted illustration, not a benchmark. Substitute the register's own band counts. Applying the ABS media release rates band by band gives 14 from the large band, 26.4 from the medium band and 26.4 from the small and micro band: an expected 67 rather than 48, on the media release rates for 2024-25 as at 25 September 2026.
The nineteen-supplier gap between 48 and 67 is the whole argument. It is not a forecast. It is the difference between sampling a register at random and sampling it where the published evidence says the density sits.
The large band is nationally tiny. Counts of Australian Businesses, including Entries and Exits, July 2022 to June 2026, released 18 August 2026, records only 5,366 businesses with 200 or more employees at 30 June 2026, out of 996,203 employing businesses. A register holding forty of them holds a concentrated slice of a very small cohort, which is an argument for treating that band as a named group rather than a percentage.
The counts in that release also show how uneven the bottom range is as a population. Counts of Australian Businesses, released 18 August 2026, records 689,600 businesses with 1 to 4 employees against 232,912 with 5 to 19 at 30 June 2026, on employee bands rather than the survey's persons employed bands, so most businesses in that range sit at its smallest end while the ABS publishes one rate of around 11 percent, as at 25 September 2026, across the whole of it. The 2024-25 release publishes that split in its data cube 6, at 10.7 percent for 0 to 4 persons employed and 12.3 percent for 5 to 19. Record which end the register sits at; the blended rate used below sits between the two.
Industry re-ranks the tiers. It does not multiply them.
The ABS does not publish a size by industry cross-tabulation for AI use in the 2024-25 release. Multiplying a size rate by an industry rate would therefore manufacture a statistic that no source supports.
The defensible rule is simpler. Employment size band sets the base rate and the tier. Industry division re-ranks rows inside a tier. Write that rule into the working paper before the register is sorted, because it is the first thing an internal audit reviewer will test.
Those are selected divisions. The 2024-25 release publishes all seventeen, and the ranking rule is the published rate itself: inside a tier, sort descending by the division rate. Divisions not shown above are ranked on their own published figure, including Health care and social assistance at 17 percent and Administrative and support services at 12 percent, as at 25 September 2026.
Financial and insurance services grew fastest in multiple terms. The ABS media release records the highest growth rate in AI adoption in that division, at twenty-four times the level recorded in 2021-22, when it was 1 percent. A register assessed for AI exposure two or three years ago is carrying an ordering built on a rate that has since multiplied.
What the data cannot carry
Four limits belong in the working paper, not a footnote.
- The survey does not measure how much AI a business uses. The 2024-25 release is explicit: "The question is not designed to measure intensity or extent of use within the business." A supplier that ticked the box may be running one summarisation tool or an entire decisioning pipeline.
- AI was one option among many. The release notes that "Business use of AI was one response option from a selection of ICTs used by business. Businesses could select more than one option." The definition is broad and covers embedded systems, not only generative tools.
- The scope excludes whole divisions. Public administration and safety, education and training and several other classes are out of scope, so a register carrying those services cannot be rated from this dataset at all.
- No source converts a population rate into a likelihood for a named business, so the output is an expected count across a segment and a priority ordering, never a score against a supplier reference.
The exposure being managed is not that a supplier uses AI. Undisclosed supplier AI use is not a breach in itself. The exposure is that the buying organisation cannot evidence a control over a process it remains accountable for.
Which segment of the register gets the next questionnaire?
The register already exists for a large part of the audience. The Australian Prudential Regulation Authority, in Prudential Standard CPS 230 Operational Risk Management, requires that "An APRA-regulated entity must identify and maintain a register of its material service providers and manage the material risks associated with using these providers", and that the register is submitted to APRA annually. The contract side of that register has been covered separately in CPS 230's 1 July deadline and your AI vendors. APRA confirms on its operational risk management page that "The updated CPS 230 and CPG 230 commence on 1 July 2026", which is the operative version as at 25 September 2026.
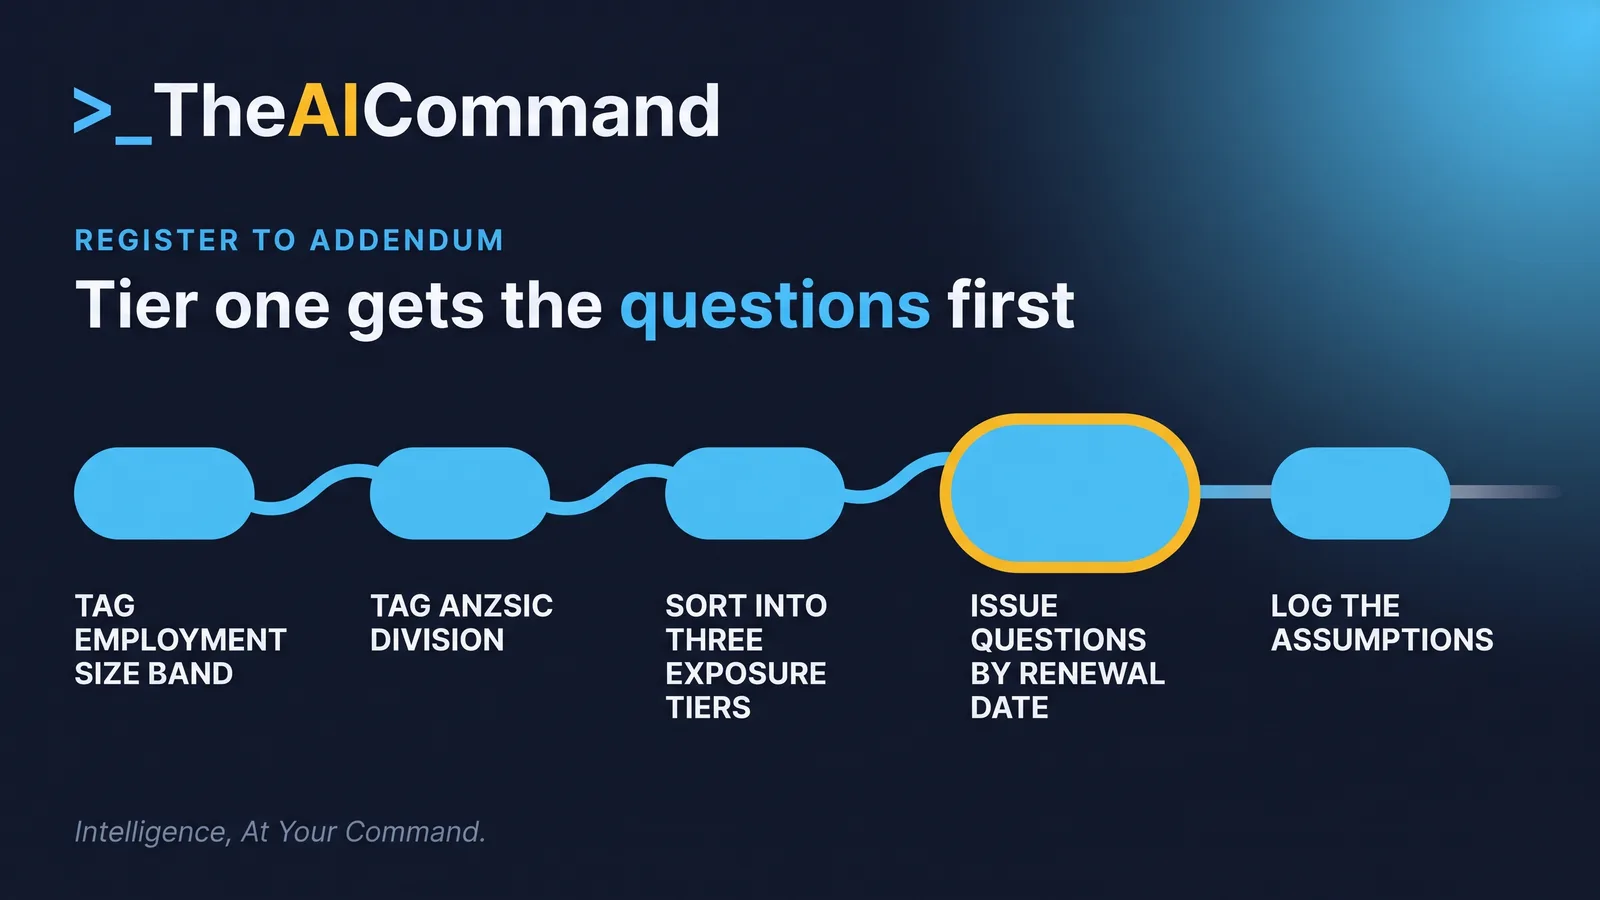
So the task is two new columns on an artefact that already has an owner and an annual date, not a new artefact. Tag each row with employment size band and Australian and New Zealand Standard Industrial Classification (ANZSIC) division, then sort.
TheAICommand works to the Verified Draft Method: de-identify the inputs, ground the model in your own source material, keep a person at the decision point, verify against the primary source, and log what happened.
Supplier names, contact details and pricing come out of the extract before anything is pasted into a model. That is part of the method, not a caveat on it.
What to check: the restated rule in step 2, word for word, because a model that silently multiplies the two rates will still produce a tidy table. Check that the arithmetic in step 4 reproduces by hand, that the set-aside rows in step 1 match the blanks in the extract, and that no row carries a per-supplier figure. The assumption list is the audit trail and goes into the working paper as returned.
Writing questions that arrive attached to a source
Questions invented by a risk team get negotiated. Questions mapped to a named obligation get answered.
Three anchors exist. For APRA-regulated entities, CPS 230 requires an entity to "undertake appropriate due diligence, including an appropriate selection process and an assessment of the ability of the service provider to provide the service on an ongoing basis", and requires the entity to address "the entity's approach to managing the risks associated with any fourth parties that material service providers rely on to deliver a critical operation to the APRA-regulated entity". The fourth party clause is the AI question at its sharpest, because the party running the model is often not the party holding the contract.
For everyone else, the Office of the Australian Information Commissioner's guidance on privacy and the use of commercially available AI products, updated 17 January 2025, states that organisations "should conduct due diligence to ensure the product is suitable to its intended uses", that due diligence "should not amount to a 'set and forget' approach", and that organisations "should also consider whether a third party receives personal information through the operation of the commercial AI product".
The third anchor is voluntary. Guidance for AI adoption: implementation guidance, published by the National AI Centre, in the version published 5 May 2026 and current as at 25 September 2026, asks organisations to "Ensure that risk management processes include steps to identify, assess and treat risks arising from other parties in the AI supply chain, such as third-party developers and third party deployers", and to "Document or request from upstream providers the technical details of the system or model that may be required to meet the needs of users within the organisation or stakeholders". It is guidance, not a standard, and describing it as anything else will cost credibility in the first supplier meeting.
One edit before the next prompt is copied. If the organisation is not regulated by APRA, delete the two CPS 230 lines from the obligation list, because CPS 230 does not bind it.
What to check: the obligation column, one row at a time, against the wording in the standard and the guidance rather than against the model output. Confirm that no question presumes adoption, since a presumptive question invites a defensive answer. Confirm at least one question reaches the supplier's own suppliers. Then have the contract owner read the table before it is issued, because the questions arrive under their name.
Reading what comes back without pre-deciding it
The answers will be uneven. Some suppliers will describe a tool in detail, some will answer in one line, and some will be silent because nobody internally knows. Silence is not a breach, and treating it as one poisons the next round.
What to check: every clause reference against the policy itself, because a fabricated clause number is the failure mode that survives review. Check that silent answers are labelled silent and not escalated, and that no rating or recommendation appears anywhere in the output. The determination belongs to [CONTRACT_OWNER], and the model's role ends at the gap list.
Do this Monday
The artefact is the material service provider register, or for a non-regulated organisation the existing supplier master list. The owner is the operational risk manager or the procurement lead who already holds that register.
- Add two columns to the register: employment size band and ANZSIC division. Take the industry division from the service description and the supplier's own published description, and the employment size band from the supplier's published headcount, the contract owner, or the supplier itself. Record an estimate as an estimate, and leave a cell blank rather than entering a band that cannot be evidenced.
- Export a de-identified extract with supplier reference, the two new columns, service description, contract owner role and renewal date.
- Run the first prompt against that extract. The size rates are written into the prompt. Attach the ABS industry table for 2024-25 if the register spans divisions beyond those listed above, and otherwise paste the six division rates from this article as the ranking figures. Save the assumption list to the working paper.
- Take tier one only and sort it by the earliest renewal date. If tier one holds fewer than five rows in this sample, take the balance from the top of tier two by division rate.
- For each of the five rows selected, run the second prompt against the existing due diligence questionnaire, the obligation list and that row's service description, so the questions are written to the service being bought. Give the five tables to the contract owner to read as a pack and to issue.
The hour covers steps one and two for the twenty highest spend rows. Run the rest of the register across the following fortnight. The check that it worked is a row count: the rows placed in the three tiers plus the rows set aside at step 1 of the first prompt equal the number of rows in the extract, with no row counted twice. If more than a quarter of the rows were set aside, the tagging is the problem rather than the data. Then confirm each tier's expected count reproduces by hand, as that tier's row count multiplied by the ABS media release rate for that band as at 25 September 2026.
The bottom line
The ABS headline of 12 percent for 2024-25 is an average over a population that no supplier register resembles. The usable material is the distribution, as at 25 September 2026: around 35 percent of large businesses, 22 percent of medium, about 11 percent of small and micro, and thirty-seven percentage points between the highest and lowest industry divisions. Weighting a register against those published rates changes which suppliers get asked first, which is the only decision the data can properly inform. Nothing here identifies a supplier that uses AI or makes undisclosed use a breach. It orders the queue, and the contract owner still makes the call.
This article is general information and education only. It is not legal, compliance, financial or professional advice.
TheAICommand. Intelligence, At Your Command.